In a month during which the nation observed the 7th anniversary of the August 2003 blackout (over 50 million consumers affected and more than $6 billions in losses), the 5th anniversary of Hurricane Katrina (more than 1800 deaths and over $150 billion in economic losses), and the August 1, 2007 collapse of the I-35W bridge in Minneapolis (killing 13 and disrupting traffic and the local economy for a year), persistent problems such as blackouts, water main breaks, and daily traffic gridlocks have stimulated growing public awareness of the necessity of accelerated programs of replacement, rehabilitation and new investment in the U.S. infrastructure[1].
Focusing on the electric power sector, power outages and power quality disturbances cost the U.S. economy over $80 billion annually, and up to $188 billion per year. Transmission and distribution losses in the U.S. were about 5% in 1970, and grew to 9.5% in 2001, due to heavier utilization and more frequent congestion. Regarding the former, starting in 1995, the amortization/depreciation rate exceeded utility construction expenditures. Since that crossover point in 1995, utility construction expenditures have lagged behind asset depreciation. This has resulted in a mode of operation of the system that is analogous to harvesting more rapidly than planting replacement seeds. As a result of these diminished "shock absorbers," the electric grid is becoming increasingly stressed, and whether the carrying capacity or safety margin will exist to support anticipated demand remains in question.
One can assess impacts using actual electric power outage data for the U.S., which are generally available from several sources, including the U.S. DOE's Energy Information Administration (EIA) and the North American Electric Reliability Corporation (NERC). In general, the EIA database contains more events, and the NERC database gives more information about the events. Both databases are extremely valuable sources of information and insight. In both databases, a report of a single event may be missing certain data elements, such as the amount of load dropped or the number of customers affected. In the NERC database, the amount of load dropped is given for the majority of the reported events, whereas the number of customers affected is given for less than half the reported events.

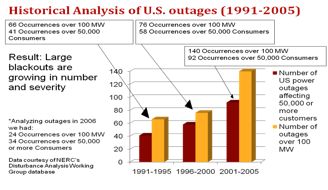
Figure 1: U.S. Electric Power Outages Over 100MW and Affecting Over 50,000 Consumers (1991-2005)
Analyses of these data revealed that in the period from 1991 to 2000, there were 76 outages of 100 MW or more in the second half of the decade, compared to 66 such occurrences in the first half (Figure 1). Furthermore, there were 41% more outages affecting 50,000 or more consumers in the second half of the 1990s than in the first half (58 outages in 1996-2000 versus 41 outages in 1991-1995). In addition, between 1996 and 2000, outages affected 15% more consumers than they did between 1991 and 1995 (the average size per event was 409,854 customers affected in the second half of the decade versus 355,204 in the first half of the decade). Similar results were determined for a multitude of additional statistics, such as the kilowatt magnitude of the outage, average load lost, etc. These trends have persisted in this decade. NERC data show that during 2001-2005, we had 140 occurrences of over 100 MW dropped, and 92 occurrences of 50,000 or more consumers affected.

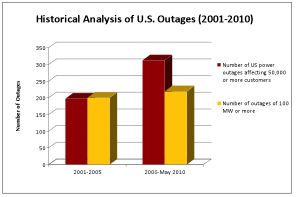
Figure 2: U.S. Electric Power Outages Over 100MW and Affecting Over 50,000 Consumers During 2001-2010 (EIA Data)
Figure 2 provides a summary of the outages[2] in the most recent decade:
- There were 200 outages of 100 MW or more during 2001-2005; such outages have increased to 219 during 2006-May 2010.
- The number of U.S. power outages affecting 50,000 or more consumers increased from 197 (during 2001-2005) to 312 (during 2006-May 2010).
Figure 3: U.S. Electric Power Outages Over 100MW and Affecting Over 50,000 Consumers During 2001-2010 (EIA Data), Adjusted for 2% Load Increase Per Year
Adjusting for 2% per year increase in load to 2001 levels (Figure 3), the above outages reflect the following trend:
- There were 189 outages of 100 MW or more during 2001-2005; such outages have slightly increased to 190 during 2006-May 2010.
- Assuming the same 2% annual demand growth, the number of U.S. power outages affecting 50,000 or more consumers increased from 186 (during 2001-2005) to 297 (during 2006-May 2010).
As an energy professional and electrical engineer, I cannot imagine how anyone could believe that in the United States we should learn to "cope" with these increasing blackouts -- and that we don't have the technical know-how, the political will, or the money to bring our power grid up to 21st century standards. Coping as a primary strategy is ultimately defeatist. We absolutely can meet the needs of a pervasively digital society that relies on microprocessor-based devices in vehicles, homes, offices, and industrial facilities. And it is not just a matter of "can." We must -- if the United States is to continue to be an economic power. However, it will not be easy or cheap.
Costs/benefits of full deployment of smart grids
In a recent nationwide survey, most of consumers in the U.S. (~68%) didn't know what the term "smart grid" meant. We must assess and clearly articulate:
1) What is the "smart grid"?
2) What are the costs/benefits and range of new consumer-centered services enabled by smart grids? What is the smart grid's potential to drive economic growth?
What is the smart self-healing grid?
Here are the definitions for the smart "self-healing" grid, which I proposed and have utilized in all pertinent projects while at EPRI and beyond since January 1998:
- The term "smart grid" refers to the use of computer, communication, sensing and control technology which operates in parallel with an electric power grid for the purpose of enhancing the reliability of electric power delivery, minimizing the cost of electric energy to consumers, improving security, quality, resilience, robustness, and facilitating the interconnection of new generating sources to the grid.
- A system that uses information, sensing, control and communication technologies to allow it to deal with unforeseen events and minimize their adverse impact. It is a secure "architected" sensing, communications, automation/control, and energy overlaid infrastructure as an integrated, reconfigurable, and electronically controlled system that will offer unprecedented flexibility and functionality, and improve system availability, security, quality, resilience and robustness.
Since then, there have been several convergent definitions of "smart grids," including within the 2007 Energy Bill, along with those in informative reports by EPRI (1998-present) and U.S. DOE (2001-2010, and definitions offered by the IEEE, FERC, GE and Wikipedia. Most define the concept in terms of functionalities and performance objectives (e.g., two-way communications, interconnectivity renewable integration, demand response, efficiency, reliability, self-healing, etc.).
There are many definitions from which an overarching vision has emerged of a highly instrumented overlaid system with advanced sensors and computing, with the use of enabling platforms and technologies for secure sensing, communications, automation and controls as keys to: 1) engage consumers, 2) enhance efficiency, 3) ensure reliability, 4) enable integration of renewables and electric transportation.
What are the costs/benefits and range of new consumer-centered services enabled by smart grids? What is the smart grid's potential to drive economic growth?
To begin addressing these, the costs of full implementation for a nationwide smart grid range over a 20-year period (2010-2030):
- Study by the Electric Power Research Institute (EPRI) published in January 2010 estimated that the actual costs will come in closer to $165 billion over the course of 20 years.
- According to energy consulting firm the Brattle Group, the necessary investment to achieve a smart grid is $1.5 trillion spread over 20 years (~$75 billion/year).
- According to my work, 1998-present, I estimate that implementation will cost $10 billion-$13 billion/year for 10 years or longer; about $150 to $170 billions over this period.
Despite the costs of implementation, integration of the smart grid will result in:
1) Costs of outages reduced by about $49B per year,
2) Increased efficiency and reduced emissions by 12% to 18% per year (PNNL report, January 2010),
3) A greater than 4% reduction in energy use by 2030, translating into $20.4 billion in savings,
4) A situation in which it is more efficient to move electrical power through the transmission system than to ship fuels the same distance. From an overall systems perspective, with goals of increased efficiency, sustainability, reliability, security and resilience, we need both:
- Local microgrids (that can be as self-sufficient as possible and island rapidly during emergencies), and
- Interconnected, smarter and stronger power grid backbone that can efficiently integrate intermittent sources, and to provide power for end-to-end electrification of transportation.
5) Reduction in the cost of infrastructure expansion and overhaul in response to annual peaks. The demand response and smart grid applications could reduce these costs significantly.
6) Increased cyber/IT security, and overall energy security, if security is built in the design as part of a layered defense system architecture.
7) Electricity's unique capability to be produced from a wide variety of local energy sources, along with its precision, cleanliness, and efficiency, make it the ideal energy carrier for economic and social development.
From a broader perspective, in the course of a single century, electricity became the foundation and prime mover of our modern society. Not just as a clean and convenient form of energy, but as the toolmaker's dream. Electricity opened the doors of invention to new technologies of incredible precision, intelligence and communication, and to new forms of instrumentation and innovation.
In addition, as noted previously, the current high-voltage system needs to be expanded and strengthened (see the U.S. DOE National Electric Transmission Congestion Study, AEP HV transmission assessment for wind integration, and EPRI assessments 2003-2009). The total cost of the expanded transmission system is about $82 billion.
On options and pathways forward, I am often asked, "Should we have a high-voltage power grid or go for a totally distributed generation with microgrids?" We need both, as the "choice" in the question poses a false dichotomy. In other words, it is not a matter of "this OR that," but rather, "AND." To elaborate briefly, from an overall energy systems perspective (with goals of efficiency, eco-friendliness, reliability, security and resilience), we need both 1) microgrids (that can be as efficient and self-sufficient as possible, and to island rapidly during emergencies), AND we need 2) a stronger and smarter power grid as a backbone to efficiently integrate intermittent renewable sources into the overall system.
A key challenge that lies before us is determining whether the electricity infrastructure that undergirds our economy, society, and quality of life will evolve to become the primary support for the 21st century's digital society that will power our innovation and economy, or will it be left behind as a 20th-century industrial relic? Finally, what are the costs of failing to implement this change?
We must modernize the electric power infrastructure, and evolve it into a smarter, stronger, more secure and more resilient system. Electricity is the linchpin and enabling infrastructure for all knowledge- and innovation-based economies.
[1] Optimizing Infrastructure Investment for the 21st Century, ASME-ITI Working Group, 2009
[2] Research is supported by a grant from the NSF. For preparations of Figures 2-3, I gratefully acknowledge Mr. Anthony Giacomoni, my Graduate Research Assistant, in the department of Electrical & Computer Engineering at the University of Minnesota-Twin Cities.